
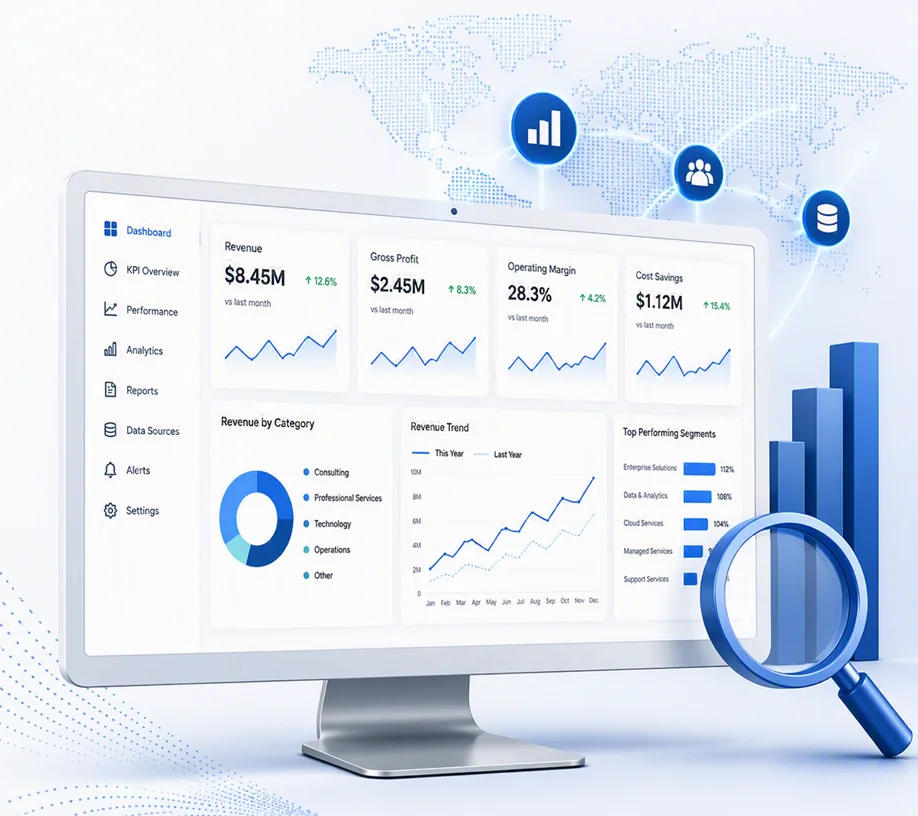
Business Operations Analytics for Accounting Firms

A practical rollout model for operational visibility dashboards, accounting BI governance, and leadership decision cadence.

Business operations analytics dashboard icon

Operational Visibility

Firms improve execution when finance, workflow, and capacity metrics live in one operational BI model.

Business operations analytics gives accounting firms a consistent view of what changed, why it changed, and where leaders should intervene first.

1. Define a leadership KPI layer

Start with business intelligence KPIs that leadership reviews weekly and monthly: realization, utilization, WIP aging, AR aging, throughput, and backlog risk.

Most firms already track these numbers somewhere—the problem is that they live in five different spreadsheets, updated on five different schedules, by five different people. Defining a leadership KPI layer means agreeing, once, on exactly how each metric is calculated and which system feeds it, so that a realization number in a partner meeting always means the same thing whether it's pulled in January or June.

2. Build an operational visibility dashboard

Use a role-based layout so partners, firm administrators, and managers can monitor queue health, cycle-time variance, and staffing pressure in real time.

A managing partner and a department manager need to see the same underlying data through different lenses—the partner wants firm-wide trend and exception flags, the manager wants which specific jobs are stuck and why. A role-based layout serves both from one governed model instead of forcing a choice between an oversimplified executive summary and an overwhelming operational grid.

3. Roll out in phases

Phase 1: baseline scorecards. Phase 2: workflow diagnostics. Phase 3: predictive indicators and AI-generated narrative summaries.

Firms that try to launch predictive analytics and AI narratives before the underlying scorecards are trusted usually end up shipping neither successfully—the fancier layer just inherits whatever data-quality problems the baseline never fixed. Baselining first also gives leadership a working reference point to judge whether phase 2's diagnostics are actually surfacing something new, rather than restating what everyone already suspected.

Implementation checklist

  • Standardize metric definitions before dashboard publication
  • Assign an owner to each KPI and escalation threshold
  • Review exceptions weekly and root-cause monthly
  • Link financial KPI shifts to workflow and staffing drivers
  • Use custom BI solutions only where differentiated workflow requires it

Business Operations Analytics: Frequently Asked Questions

What is business operations analytics for an accounting firm?

Business operations analytics is the practice of tracking finance, workflow, and staff capacity metrics in one connected model, rather than as three separate reporting exercises—so a shift in one (like a realization drop) can be traced to its driver in another (like a specific team's overloaded queue).

How long does a business operations dashboard rollout take?

Most firms can stand up baseline scorecards—the phase 1 rollout—within a few weeks once metric definitions are agreed on. Workflow diagnostics and predictive indicators are additive phases layered on afterward, not prerequisites to getting the first useful dashboard live.

Who should own KPI definitions at an accounting firm?

Each KPI should have one named owner responsible for its calculation logic and any changes to it, typically a firm administrator or operations lead working with the partner who consumes the metric—so a formula change never reaches a dashboard without someone accountable for it.