
See Which Managers Are Overloading Staff Before Turnover Happens
Capacity planning and workload visibility for managing partners, directors, and managers—built on CCH Workflow data and delivered through Microsoft Power BI to surface cycle times, bottlenecks, staff utilization, and on-time completion rates in real time, before burnout costs you your best people.
WorkSight Metrics™
Reveal bottlenecks, accelerate turnaround, and optimize your accounting practice with AI-assisted workflow analytics.
Built specifically for firms running CCH Workflow, WorkSight Metrics™ delivers deep visibility into tax and workflow operations. By combining SQL-based data modeling with AI-enhanced insight generation, WorkSight Metrics™ helps firms understand not just what is happening in their workflow—but why.
Built on CCH Workflow Data
WorkSight Metrics™ connects directly to CCH Workflow to extract job status, assignment history, cycle times, and staff workload data—transforming it into real-time dashboards, delivered through Power BI, that your managers and partners can act on. No manual data pulls. No spreadsheet assembly.
See how we handle your firm’s data and what setup actually involves.
If your firm uses CCH Workflow and wants better visibility into return turnaround, bottleneck stages, and staff capacity, WorkSight Metrics™ is purpose-built for that need. See our accounting firm KPI benchmarks for staff utilization target ranges by role.
AI-Enhanced Capabilities
Cycle Time Prediction
AI models forecast return completion timelines based on historical patterns, staff load, and return complexity—giving tax managers a reliable turnaround outlook before deadlines become problems.
Bottleneck Identification
Intelligent analysis highlights where returns slow down and which workflow stages consistently create delays—critical visibility for managing partners and tax practice leaders.
Staff Load Balancing Recommendations
AI-assisted insights help managers distribute work more efficiently during peak periods, improving utilization and reducing burnout risk.
Smart Narrative Explanations
Automatically generated summaries explain workflow trends, delays, and performance shifts in plain language—ready for partner review without manual analysis.
Who WorkSight Metrics™ is Designed For:
CPA and tax firms are professional services firms in their own right, running on the same billable-work, staff-utilization, and turnaround pressures as any other professional services practice—just tracked through CCH Workflow instead of a generic time-and-billing system.
- Managing Partners — firm-wide tax workflow performance and on-time completion visibility
- Directors and Managers — cycle time analytics, staff utilization, and bottleneck identification by job or stage
- Firm Administrators — team workload monitoring, capacity planning, and backlog reporting
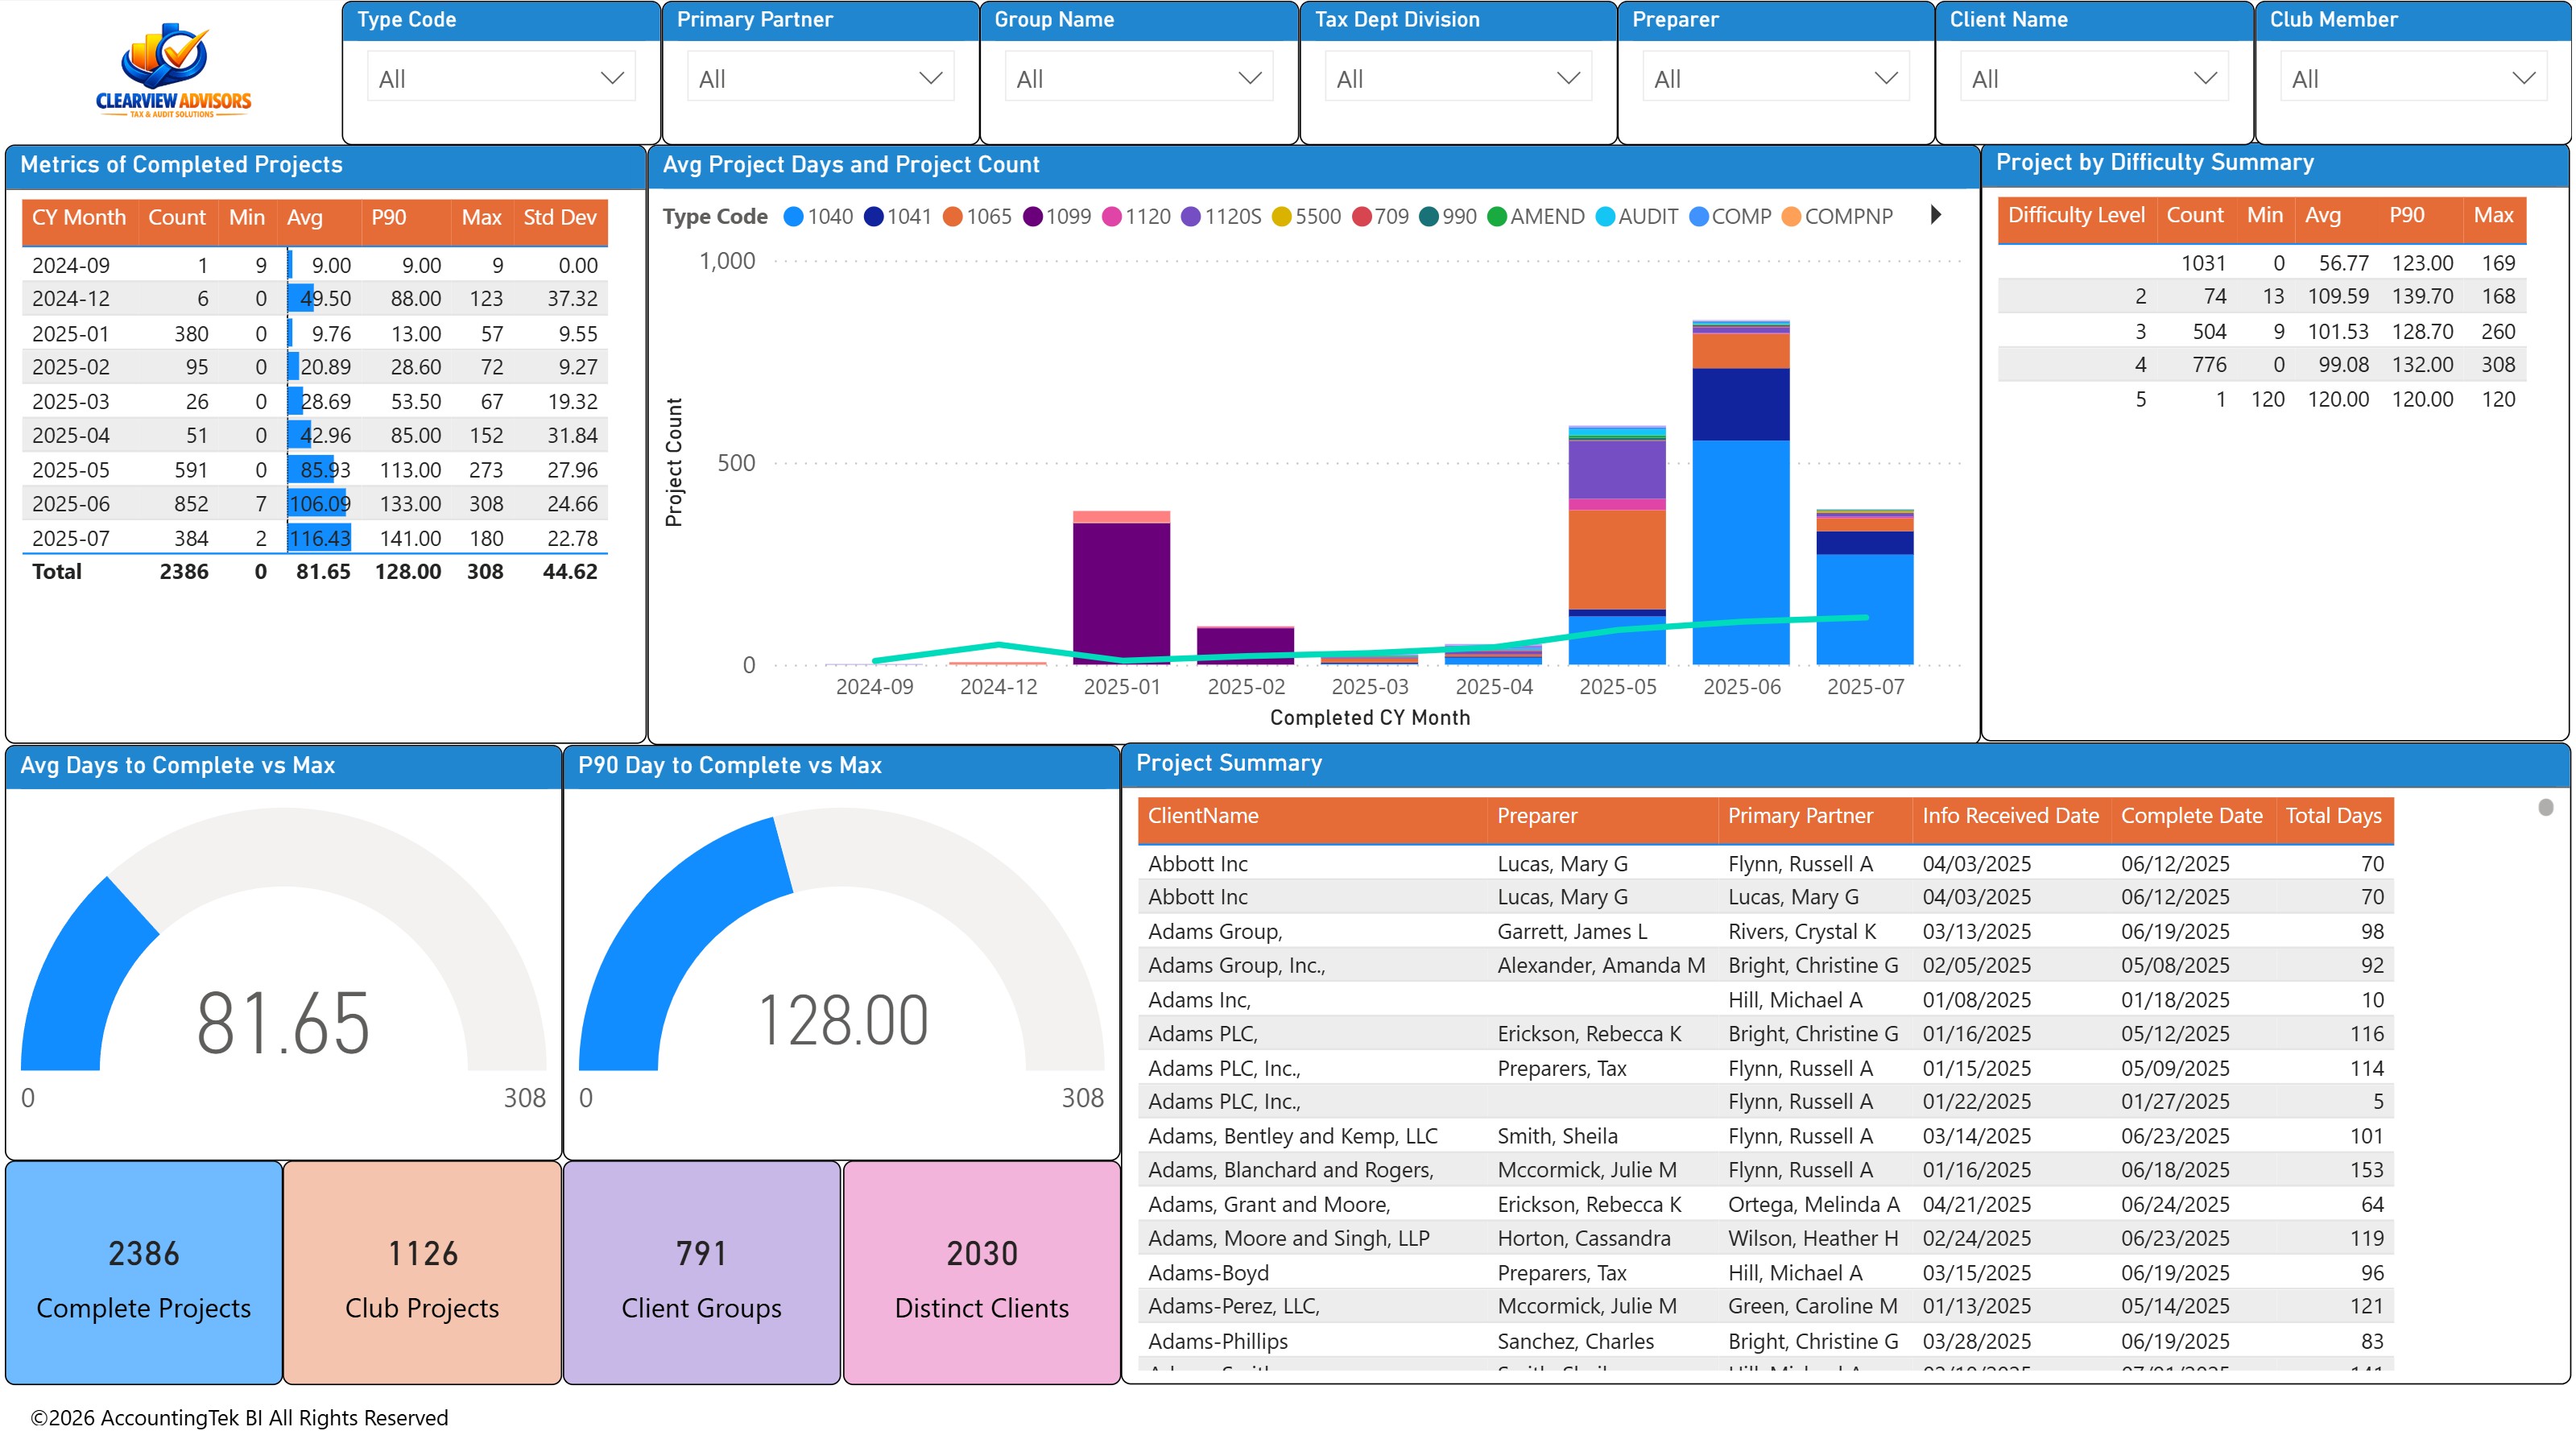
What WorkSight Metrics™ Delivers
- End-to-end visibility into CCH Workflow job and tax return performance
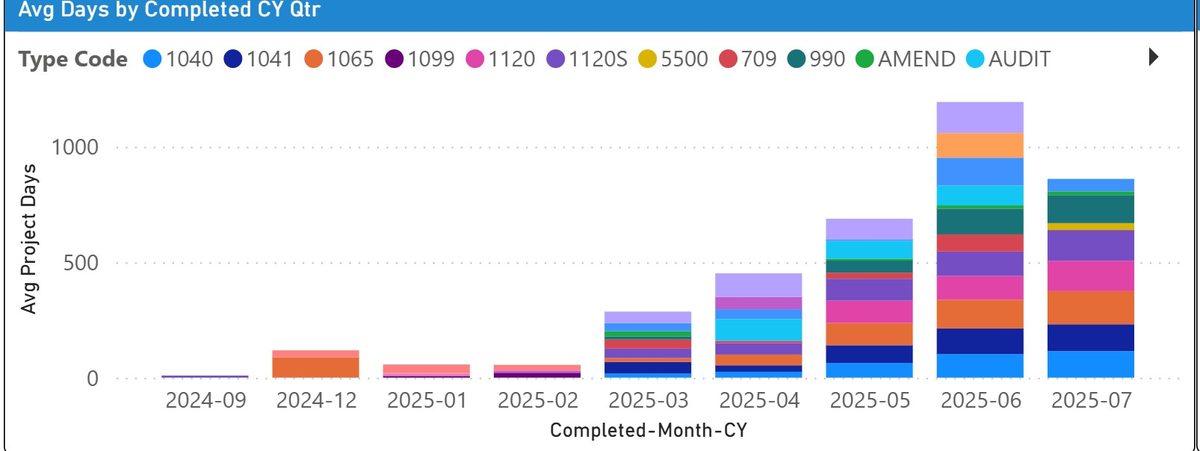
- Cycle time, on-time completion, and backlog analytics
- Team workload monitoring and staff capacity reporting
- AI-generated operational summaries for managers and partners
- Predictive indicators that help firms stay ahead of bottlenecks
- Direct integration with CCH Workflow—no manual exports required
Operational Visibility Dashboard for Workflow Leaders
WorkSight Metrics™ acts as an operational visibility dashboard for accounting firms that need day-to-day insight into return flow, queue aging, and staff workload. This operational BI layer helps leaders move from reactive reporting to proactive execution.
- Pipeline status visibility by stage, owner, and due-date risk
- Cycle-time variance tracking for faster bottleneck remediation
- Capacity and handoff insight to rebalance work during peak periods
- Operational trend analysis that supports staffing and deadline planning
What Good Workflow Performance Looks Like
Managing partners and directors evaluating workflow health measure it against benchmarks such as:
- Staff utilization: target 80%+ chargeable for staff accountants, 55–70% for directors and managers — the same role-based ranges FirmMetrics™ tracks on the billing side. See our utilization & chargeability rate benchmarks.
- Bottleneck stage dwell time: no single workflow stage should hold more than 20% of active jobs for 2+ weeks; above 30% is a warning sign. See our staff capacity planning guide.
- Manager span of control: 6–10 direct reports works for most review-heavy workflows; recalibrate above 12, especially during peak season.
WorkSight Metrics™ surfaces these signals automatically from CCH Workflow data — no manual tracking, and no waiting for an exit interview to learn a manager was over capacity for two months.
For end-to-end business intelligence KPIs, pair WorkSight Metrics™ with FirmMetrics™.
WorkSight Metrics™ is the tax firm workflow analytics platform built for accounting firms that run CCH Workflow—turning job status, cycle times, and staff utilization data into a real-time operational BI dashboard your managing partners, directors, and managers can act on every day. Powered by AI, delivered through Power BI.